
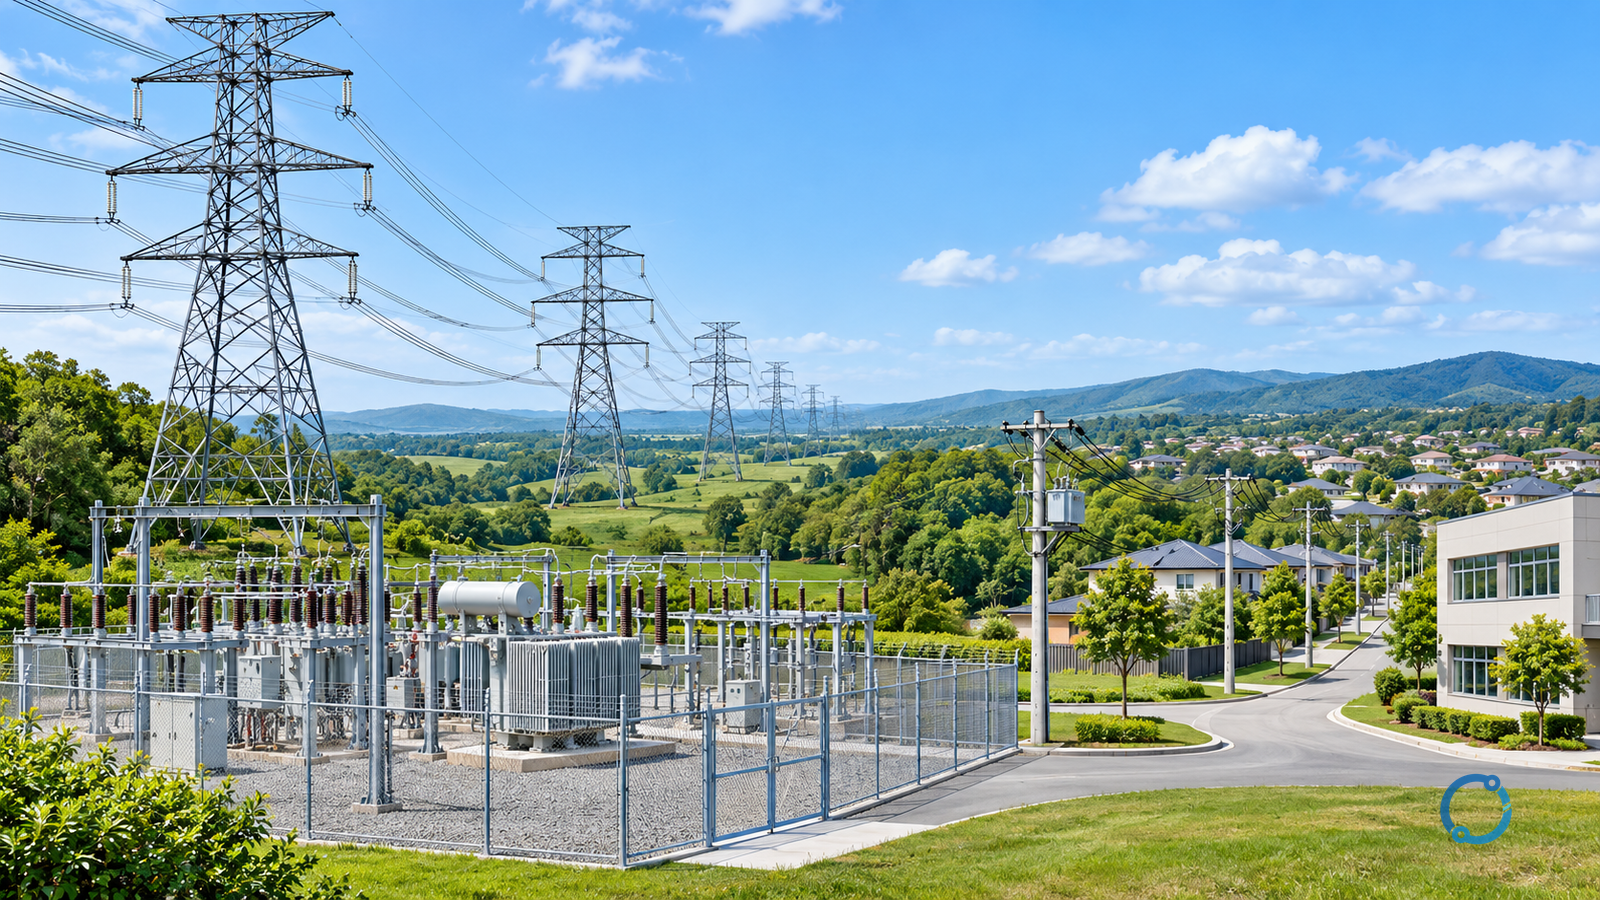
Transmission carries bulk electricity between generation and major network nodes. Distribution delivers it through local networks to customers. Voltage is an important clue, but network function and the local classification determine the boundary.
The EIA explanation of electricity delivery follows the route through power lines, substations and transformers. That route is a useful starting point for reading a grid diagram; it is not a universal list of voltage cutoffs.
Compare the jobs of the two networks
| Feature | Transmission | Distribution |
|---|---|---|
| Main task | Transfer bulk power between major nodes | Deliver power to local customers |
| Common physical clues | Large line structures and major substations | Local feeders, customer-area transformers and service circuits |
| Voltage relationship | Generally higher for bulk transfer | Reduced in stages toward utilization voltages |
| Classification check | Operator’s network designation and function | Operator’s network designation and function |
A transformer changes voltage between network levels. A substation also contains switching, protection and monitoring equipment; it is more than a transformer enclosure. OHELE’s distribution-substation guide covers that equipment-level question.
Follow electricity toward a customer
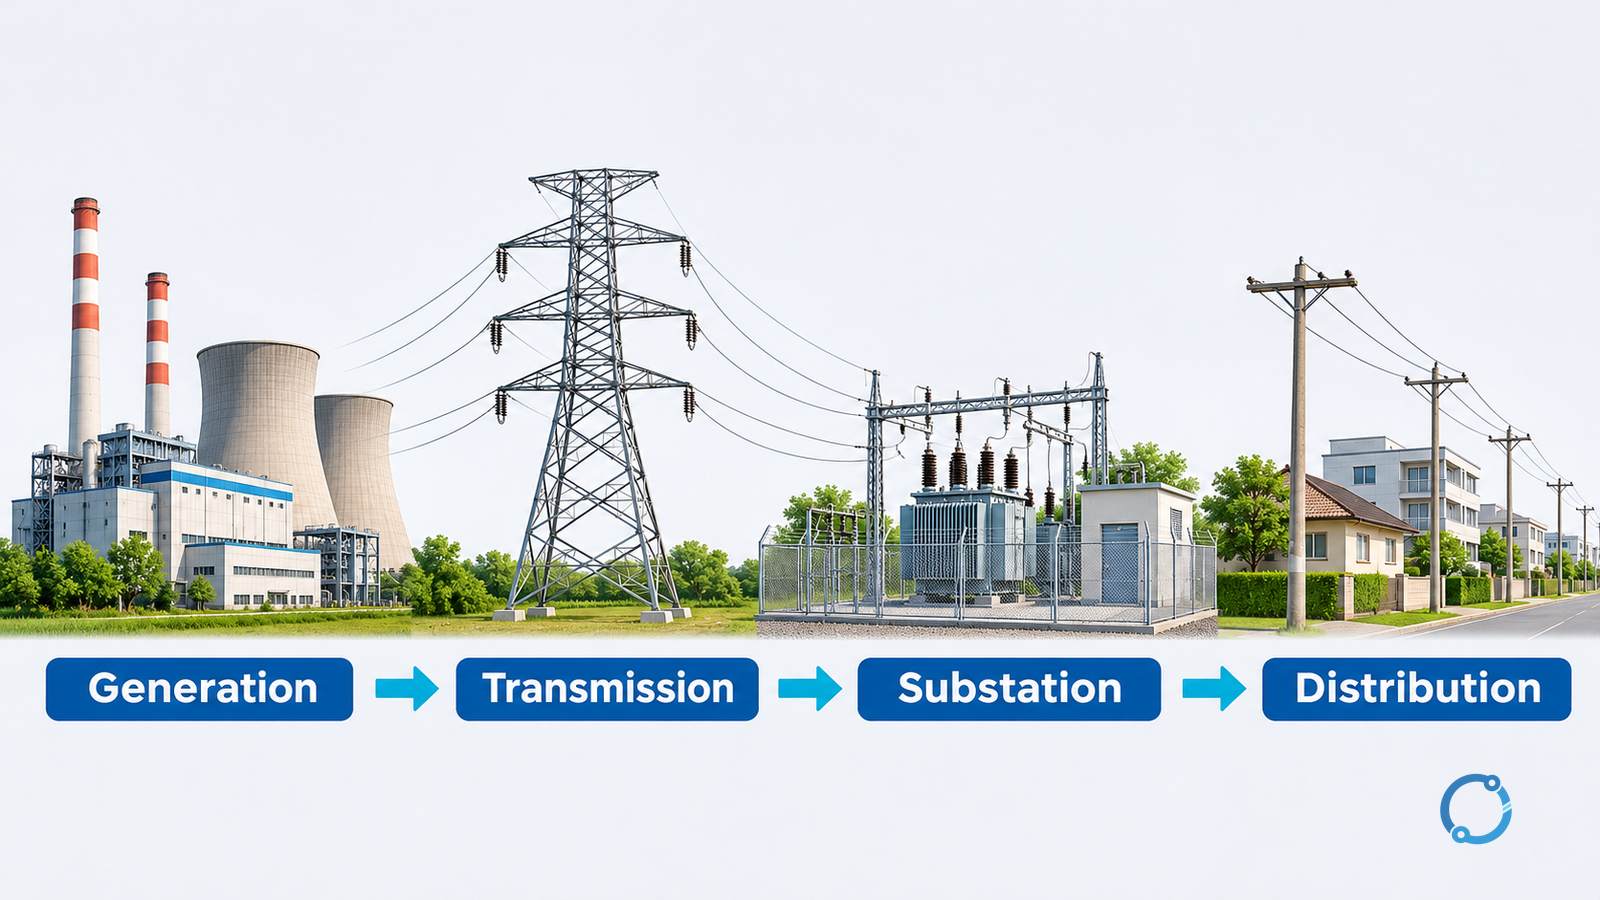
A conventional centralized-generation diagram starts at a power station, passes through a step-up transformer and transmission network, then through step-down substations and local distribution. Customer-area transformers make another voltage change where required.
The DOE transmission and distribution primer, pages 1–3, explains those stages. It also notes that distributed generation can feed power back from customer locations. The familiar left-to-right diagram therefore shows one route, not a rule that power can only move one way.
Why use higher voltage for bulk transfer?
For an approximately balanced three-phase AC system:
Real power P = √3 × line voltage V × line current I × power factor.
If power and power factor stay constant, doubling voltage halves current. With the same conductor resistance, resistive heating varies with current squared. Halving current reduces that particular loss to one quarter.
Here is an explicitly hypothetical calculation, not a real feeder design. Transfer 10 MW at unity power factor:
- At 10 kV, current is 10,000,000/(√3 × 10,000) = 577 A.
- At 100 kV, current is 10,000,000/(√3 × 100,000) = 57.7 A.
With a deliberately assumed resistance of 1 Ω per phase in both cases, total resistive loss is 3I²R: approximately 1 MW and 10 kW, respectively. That hundredfold difference follows from a tenfold current reduction.
This comparison isolates one relationship. Real lines have different conductors, distances, insulation and operating constraints; transformer losses and reactive behavior are not included. Do not interpret it as the measured efficiency of either network.
Is there one voltage that separates transmission and distribution?
No single worldwide boundary should be inferred from these introductory descriptions. In its US educational material, OSHA gives typical transmission voltages of 69–765 kV and typical distribution voltages of 4–46 kV, while also including lower-voltage secondary systems in distribution.
These are scoped examples, not global definitions or permission to treat any distribution line as safe. DOE’s primer describes typical distribution below 34 kV, illustrating why sources with different explanatory scopes need not supply the same cutoff.
For a particular asset, obtain the utility’s designation and connection documents rather than assigning ownership or rules from voltage alone.
Read a network diagram without overclaiming
Locate generation, voltage-changing points, bulk-transfer paths and customer feeders. Then check which operator owns each section and how the diagram identifies voltage levels. A large industrial customer may have a different connection arrangement from a household; do not force every customer into the same final stage.
The distinction helps identify where an asset sits in the delivery chain. It cannot diagnose an outage from a diagram alone, establish protective settings or authorize work on a line. Those tasks require the actual network records and operating procedures.