
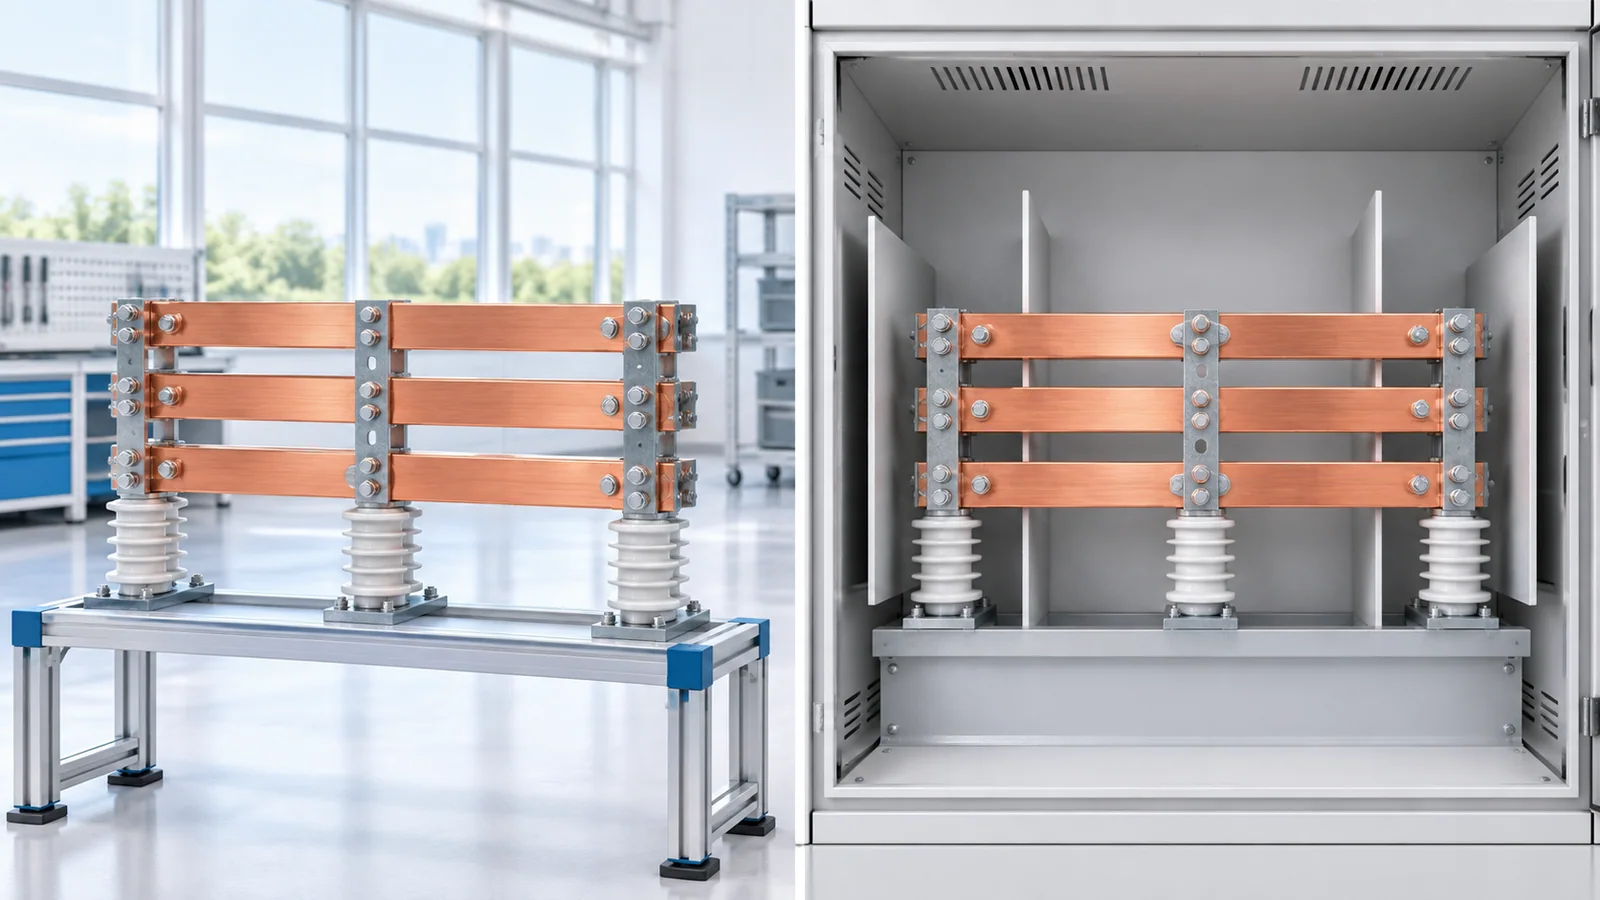
There is no universal copper busbar ampacity table. A current value is meaningful only with the bar dimensions and orientation, number of bars per phase, spacing, ambient temperature, permitted temperature rise, enclosure and ventilation, AC frequency, joint design, surface condition and verification method stated beside it.
Use a published table only as a documented starting point for the same geometry and installation. Then calculate conductor loss, account for AC and environmental effects, and verify the completed assembly. For low-voltage switchgear, IEC 61439-1:2020 defines assembly requirements and verification; it does not turn one generic ampacity chart into a compliant design.
What “ampacity” means for a busbar
Busbar ampacity is the continuous RMS current that a defined conductor arrangement can carry under defined service conditions without exceeding the applicable temperature limits. It is not an intrinsic property of a copper cross-section.
The steady temperature is reached when electrical heat generated in the bars and connections is balanced by convection, radiation and conduction into the surrounding structure. In compact equipment, heat from breakers, contactors, cables and adjacent phases joins that balance. A bar that runs acceptably in open air may exceed the permitted temperature inside a partitioned enclosure.
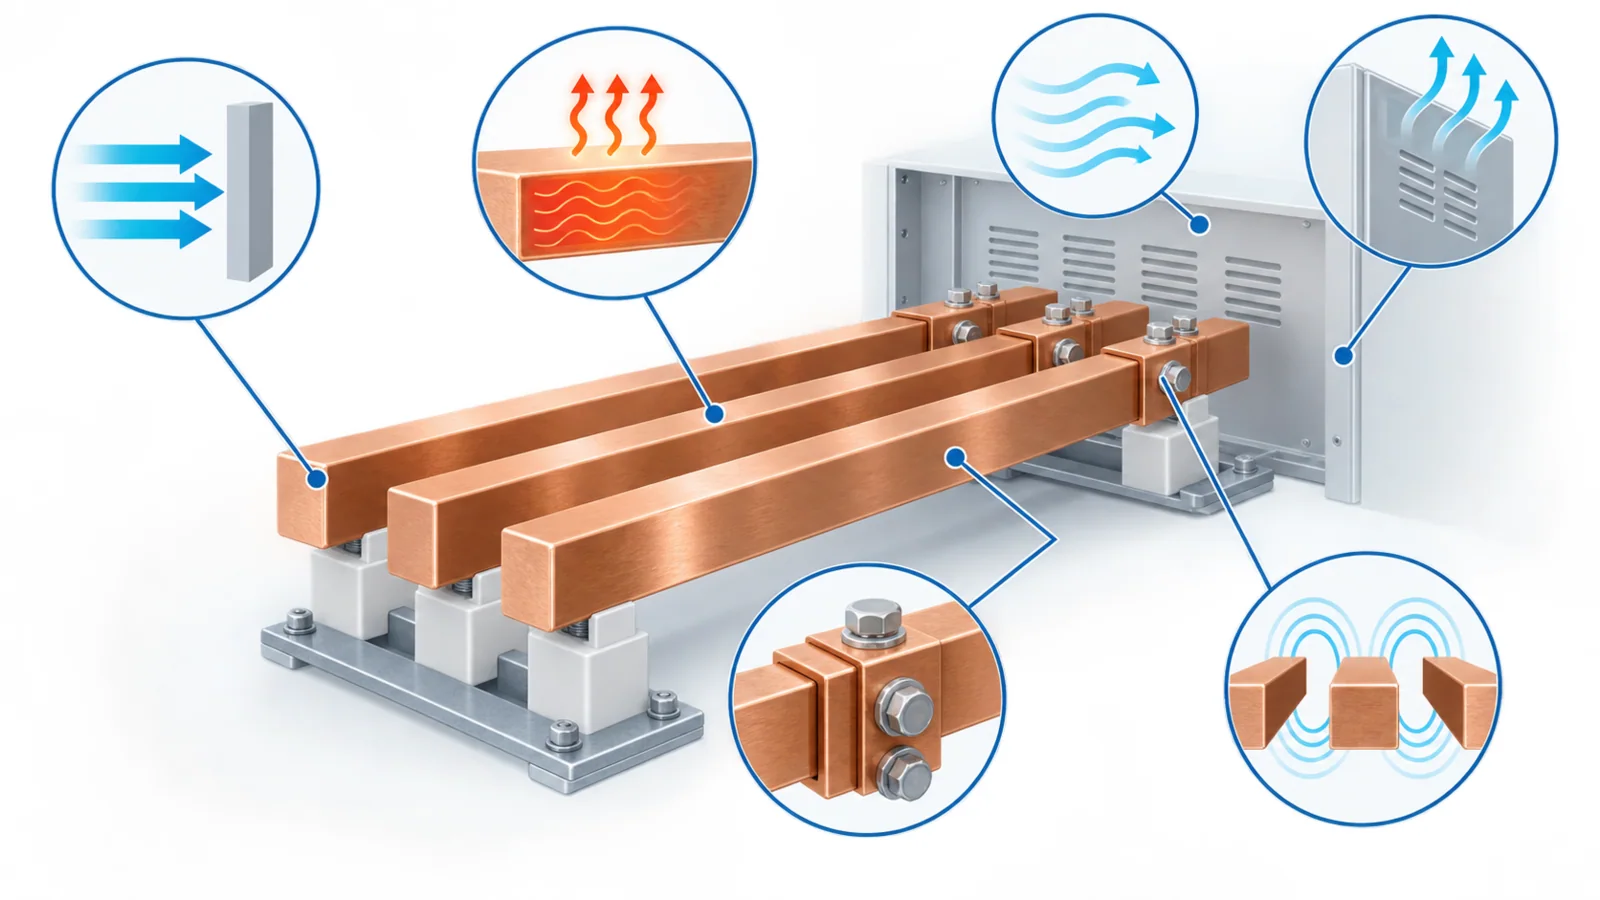
The four numbers every ampacity value needs
Before using a table, record:
- Reference current, Iref. The continuous RMS current in the stated test or calculation.
- Reference ambient, θa,ref. Air temperature around the arrangement, not a distant room reading.
- Reference conductor limit, θmax. The maximum permitted temperature or temperature rise at the location being evaluated.
- Reference arrangement. Material, dimensions, orientation, spacing, parallel bars, enclosure, ventilation and AC frequency.
If any of these are missing, the value is unsuitable for final selection. Treat it as a comparison clue, not a rating.
Start with resistance and conductor loss
For a uniform bar, the DC resistance at a reference temperature is:
R = ρL / A
where:
- R is resistance in ohms;
- ρ is copper resistivity in ohm-metres at the reference temperature;
- L is current-path length in metres;
- A is conductor cross-sectional area in square metres.
The conductor loss is:
P = I²R
For three phases with equal paths, the total straight-bar loss is approximately 3I²R, before adding joint, neutral, harmonic and proximity effects.
Copper resistance increases with temperature. For a practical linear correction:
Rθ = R20 × [1 + α20(θ − 20)]
The historical NIST copper data gives a temperature coefficient near 0.00394 per °C at 20°C for 100% conductivity copper over the stated range. Real busbar material and fabrication tolerances should come from the project material specification; the equation is a transparent estimate, not proof of a finished assembly.
Worked loss comparison
Assume one phase uses a 1 m long copper bar, 80 mm wide and 10 mm thick.
- Area: 80 × 10 = 800 mm²
- Use illustrative resistivity at 20°C: 0.01724 Ω·mm²/m
- Resistance at 20°C: 0.01724 / 800 = 21.55 µΩ
At 1,600 A:
P20 = 1,600² × 21.55 µΩ ≈ 55.2 W per phase-metre
At an estimated bar temperature of 80°C:
R80 ≈ R20 × [1 + 0.00394 × 60] ≈ 1.236R20
P80 ≈ 68.2 W per phase-metre
Across three phases, that is about 205 W per metre of straight busbar, before connection losses and AC resistance. The example does not establish 1,600 A as acceptable. It supplies a heat-loss input for thermal evaluation and shows why using cold resistance understates operating loss.
AC and DC do not use the same thermal assumption
For DC, current distribution through a homogeneous rectangular bar is comparatively uniform once local connection effects are excluded. For AC, skin effect and proximity effect make current density non-uniform. The effective AC resistance can therefore exceed the DC resistance at the same temperature.
The difference depends on:
- frequency;
- bar thickness and width;
- spacing between phases and parallel bars;
- phase order and relative orientation;
- nearby steel and conductive structures;
- harmonic spectrum;
- joint and connection geometry.
At 50 or 60 Hz, a thin single bar may have a modest AC increase, while thick bars, close stacks and poorly arranged parallel paths can produce a meaningful rise. Do not apply one “AC derating percentage” to every layout. Use a method appropriate to the geometry, validated design data, simulation or test.
DC systems have their own boundary conditions. Pole arrangement, return path, ripple current, enclosure heating and fault withstand still matter. The absence of 50/60 Hz skin effect does not make an open-air DC value valid inside a cabinet.
A defensible derating worksheet
Avoid multiplying unrelated percentages without understanding their basis. Organize corrections by the mechanism they represent.
| Mechanism | Input to capture | Engineering response |
|---|---|---|
| Ambient temperature | local inlet and internal air temperatures; daily/seasonal limit | recalculate available temperature rise and assembly heat balance |
| Enclosure | dimensions, material, partitions, wall position, openings | calculate or test internal air temperature; include all device losses |
| Orientation | flat or edgewise; vertical or horizontal run | use data or verification matching the orientation |
| Parallel bars | quantity, spacing, symmetry, connection balance | check current sharing and AC proximity effects |
| AC frequency/harmonics | fundamental frequency and current spectrum | use effective RMS current and appropriate AC resistance |
| Joints | overlap, fasteners, plating, surface preparation, pressure | allocate joint loss and verify terminal temperature |
| Altitude | site altitude and cooling medium conditions | apply the relevant assembly and insulation rules |
| Solar/external heat | exposure and adjacent heat sources | include added thermal load and changed cooling surfaces |
| Short-circuit duty | RMS duration and peak current | check thermal and electrodynamic withstand separately |
A single correction factor is acceptable only when its source states the same arrangement and defines what it corrects. Ambient correction from one table plus enclosure correction from another may double-count the same loss of cooling.
Why ambient derating is not a simple ratio
A tempting approximation is to scale current with the square root of available temperature rise:
I2 ≈ I1 × √[(θmax − θa,2) / (θmax − θa,1)]
This follows from I²R heating and can be useful for sensitivity analysis if resistance, heat-transfer coefficient and geometry are treated as constant. Those assumptions are not fully true: resistance changes with temperature, natural convection changes with temperature difference, and enclosure air is not uniform.
Use the equation to see direction and approximate magnitude, not to certify an assembly. For example, if a reference arrangement permits a 65 K rise at 35°C ambient but the project ambient is 50°C with the same 100°C conductor limit, the available rise falls to 50 K:
I2/I1 ≈ √(50/65) ≈ 0.877
The result suggests roughly 88% of the reference current under the simplified assumptions. It is not a universal 12% derating rule. The complete thermal model must be recalculated.
Enclosure verification controls the final answer
IEC TR 60890:2022 provides a calculation method for air temperature rise inside low-voltage assembly enclosures and partitioned sections. Its official scope notes alignment with IEC 61439-1:2020, treatment of enclosure and ventilation effects, and an applicability boundary extending to 3,200 A. It is primarily applicable to enclosed assemblies without forced ventilation, although the current edition adds guidance related to ventilation management.
The method estimates internal air temperature. It does not replace every conductor, connection or device verification. Use it within its stated validity conditions and with credible total power-loss inputs.
The final design route should be one permitted by the applicable assembly standard and project specification, such as:
- verification by test;
- comparison with a tested reference design under allowed rules;
- calculation where the standard and method permit it.
Do not claim that a bare-bar ampacity calculation alone verifies an IEC 61439 assembly.
Joints often set the practical limit
The straight bar can have adequate thermal margin while a bolted joint, device terminal or cable connection runs hotter. Joint resistance is controlled by interface area and pressure, surface condition, plating compatibility, fastener system, assembly process and long-term mechanical stability.
Include each joint as a separate thermal object:
- identify the current path and contact interfaces;
- use validated connection-loss data or measure resistance;
- include the loss in the enclosure heat balance;
- verify terminal and accessible-surface temperature limits;
- define torque or tensioning method in manufacturing instructions;
- define routine inspection without inventing an interval unsupported by the equipment instructions or site reliability plan.
Adding copper area away from a poor joint may not solve the hotspot.
Short-circuit withstand is a separate gate
Continuous ampacity addresses steady heating. A busbar must also withstand short-circuit thermal energy and peak electrodynamic force for the specified fault level and clearing time. The supports, spacing, joint system and enclosure structure participate in that duty.
Do not infer short-circuit withstand from continuous current density. Obtain the prospective fault current and protective-device clearing time, then verify the complete conductor and support arrangement by the applicable standard method.
How to compare two candidate arrangements
Normalize both options to the same inputs:
| Input | Candidate A | Candidate B |
|---|---|---|
| Copper grade and conductivity | stated | stated |
| Bars per phase and dimensions | stated | stated |
| Orientation and spacing | stated | stated |
| Current and frequency | same duty | same duty |
| Local ambient | same value | same value |
| Enclosure/partition | same model | same model |
| Straight-bar loss at hot resistance | calculated | calculated |
| Joint/device loss | included | included |
| Maximum predicted/measured temperature | recorded | recorded |
| Short-circuit verification | recorded | recorded |
This comparison is more useful than two headline ampacity values because it reveals why one option performs differently and whether the assumptions match the project.
Selection and verification checklist
- Define continuous current, harmonics, duty cycle and emergency loading.
- Define maximum local ambient, altitude, solar exposure and enclosure location.
- Select preliminary material, area, orientation, spacing and number of parallel bars.
- Calculate hot DC resistance and I²R loss.
- Evaluate AC resistance and current sharing for the actual geometry.
- Add losses from joints, devices, cables and adjacent conductors.
- Calculate enclosure air temperature within the method’s validity, or test the assembly.
- Verify conductor, joint, terminal and accessible-surface temperatures.
- Verify short-circuit thermal and electrodynamic withstand.
- Record the standard edition, design assumptions, manufacturing controls and verification evidence.
For the enclosure-specific iteration, continue with OHELE’s guide to compact switchgear busbar sizing.
Bottom line
A trustworthy copper busbar ampacity value is a documented thermal result, not a property of “80 × 10 copper.” Start with resistance and loss, distinguish AC from DC, state every environmental and geometric condition, and verify the complete assembly. If a table omits its reference arrangement or the project differs materially, do not hide the uncertainty behind a derating percentage—recalculate or test.