

A power-quality measurement plan is more than a list of meters and channels. It is an evidence design. It begins with the decision that the data must support, then defines where to measure, which quantities and events matter, how long to record, how time and phase are referenced and what makes the resulting dataset acceptable.
That sequence prevents two common failures. One is collecting large volumes of data without knowing how to answer the original question. The other is carrying out a short spot measurement for a problem that occurs only during a rare operating state. IEC 61000-4-30:2025 supplies measurement methods for many power-quality phenomena, while IEEE 1159-2019 provides recommended practice for monitoring electrical power quality. Neither standard decides the project’s pass/fail limits or tells an engineer which investigation is worth funding.
This guide uses an eight-gate plan. The result is a scope another competent engineer can review before instruments are installed and a dataset that can still be interpreted months later. Work near energised electrical equipment must follow the site’s approved isolation, risk-assessment, PPE and qualified-person procedures. In U.S. general industry, the relevant work-practice boundary is also addressed by OSHA 29 CFR 1910.333.
Start with the decision, not the instrument
Write the decision the study must support in one sentence. Useful examples are:
- determine whether a voltage disturbance at a controller coincides with a process trip;
- characterise the harmonic current drawn by a new load before selecting mitigation;
- establish a baseline before a UPS, capacitor bank or generator change;
- compare the supply quality at two points during the same operating state;
- verify whether recurring motor trips align with voltage unbalance or starting events;
- determine whether a long-term monitoring programme is justified after a specific event.
Each sentence implies a different measurement point, duration and output. If the question is “is power quality good?” the planner still has to define which phenomenon, at which terminals, under which operating conditions and against which compatibility or contractual requirement. “Good” cannot be inferred from a clean waveform displayed on one screen.
The plan should also record what will not be answered. For example, a monitoring campaign at the service entrance cannot establish the voltage seen by every remote device on every feeder. A current measurement with one clamp cannot prove that all phases are balanced. A power-quality monitor may record an event while remaining unable to show the mechanical, control or process evidence needed to explain the consequence.
Define the system boundary and operating states
Draw the relevant source, transformer, switchboard, feeder, protected equipment and measurement candidates. Mark the neutral and protective bonding arrangement where the investigation may involve voltage unbalance, harmonics or residual current. Add any generator, UPS, transfer switch, energy-storage converter or variable-frequency drive that can change the supply topology.
Then list the operating states that matter. Common states include normal production, light load, startup, process batch, transfer to another source, regeneration, capacitor switching, a large motor start and planned utility switching. A monitoring plan that samples only the quietest hour cannot explain an event that occurs during a weekly changeover.
For each state, record who can identify its start and end and how that evidence will enter the timeline. The most useful power-quality report is often the one that can align a voltage event with a process state, breaker operation and equipment alarm. That alignment depends on shared time references and contemporaneous notes, not only on high sampling bandwidth.
Separate events from aggregated trends
Power-quality data fall into two related but different pools:
| Data type | Typical use | Planning consequence |
|---|---|---|
| Event or waveform record | Dips, swells, interruptions, transients and short-duration changes | High time resolution, event thresholds and adequate pre/post-event memory |
| Continuous trend | RMS voltage and current, unbalance, harmonics and long-term loading | Defined aggregation, interval storage and a sufficiently long observation period |
| Power and energy data | Load growth, losses and operating-state comparison | Correct CT/VT ratio, direction convention, phase labels and interval boundaries |
| State or process log | Explains what the system was doing when an event occurred | External timestamps and a named owner for annotations |
Do not ask one dataset to be both a fast event recorder and a months-long summary unless the monitor has been configured and validated for that combined duty. Keep the intended purpose beside every channel.
The duration should follow the event frequency and decision cycle. A repetitive disturbance may require several occurrences over days. A seasonal load effect may require weeks or a longer campaign. A commissioning comparison may need repeated measurements only during defined tests. The plan should state the ending condition: number of events captured, observation time achieved, load states covered or evidence exhausted.
Select measurement points and channel roles
For every proposed location, record:
- unique point identifier and electrical location;
- nominal voltage and system connection;
- phase and neutral availability;
- upstream and downstream boundary;
- operating state represented;
- instrument owner and access condition;
- CT and VT ratios, class and polarity where applicable;
- protection, isolation and temporary-installation method.
Use a “measurement reason” for each channel rather than a generic list of every quantity the instrument can display. A voltage sag investigation normally needs voltage, event timestamps and enough current evidence to establish the direction of the disturbance. A harmonic study may require phase currents, neutral current and the spectrum or aggregation appropriate to the selected method. A motor-unbalance investigation needs all relevant line voltages and currents under the same operating condition.
Measurement at both sides of a transformer or converter can be useful when the question involves transfer of harmonics or load behaviour. But multiple points multiply the requirements for synchronisation, scaling and data management. Add a second location only when it answers a defined part of the decision.
Link each phenomenon to a measurement method
IEC has separate methods for different quantities. Harmonic and interharmonic measurement is associated with IEC 61000-4-7, and flicker measurement is associated with IEC 61000-4-15:2010 with its interpretation sheet. Before specifying a monitor setting, state the phenomenon and aggregation required by the study.
This matters because an average RMS voltage cannot describe a short dip. A cycle-by-cycle voltage value cannot be used directly as a steady-state compatibility result. A harmonic report without its aggregation interval and phase convention is incomplete. A flicker value without the applicable method and observation interval cannot be compared with an unrelated meter’s output merely because both use the same name.
The measurement method and the assessment limit are separate decisions. IEC 61000-4-30 describes measurement methods and classes for in-situ AC power-quality measurement. IEEE 519-2022 addresses harmonic goals at a point of common coupling within its scope. Project contracts, grid requirements, equipment immunity and the governing compatibility standards may introduce additional limits. The plan should name the authority for each limit rather than inventing a universal threshold.
Select the measurement class deliberately
IEC 61000-4-30 identifies Class A and Class S measurement concepts. The class decision should match the use of the result. A contractual or dispute-grade measurement may require stricter agreement about instrument class, calibration, time uncertainty and evidence retention. A temporary survey or internal screening exercise may have different requirements.
Regardless of class, capture the instrument identity, firmware, calibration status, measurement settings and accessories. An interchangeable display does not prove that two instruments use the same aggregation method, CT scaling, phase reference or clock discipline. Where different instruments are used at adjacent points, define how their data will be compared.
Do not select a permanent monitor merely because it is more capable than a portable analyser. Permanent monitoring makes sense when the decision requires continuous visibility, repeat events, remote alarms or an operational trend. A temporary study is often better when the investigation is bounded, the access risk is lower or the required instrument is specialised. The answer should be justified by the evidence plan.
Control time, phase and scaling
Time is part of the measurement. Record the time zone, daylight-saving convention and whether the monitor uses an external time reference. A time error of minutes makes a millisecond event difficult to correlate with a process controller. Where several instruments are used, define their allowed time difference and how it will be checked at the start and end of the campaign.
Define phase rotation and label V1, V2, V3, I1, I2 and I3 by the same convention across every point. A phase swap can change the meaning of real power, unbalance and harmonic phase relationships. Record the polarity arrow of each current transformer or flexible probe and the direction of power flow represented by positive values.
Scaling errors are especially difficult to detect after the instrument has left site. Record the CT ratio, voltage divider or transformer ratio and any transducer output that the monitor converts. Confirm that the instrument uses the intended ratio and that a test value survives export into the analysis file. Never normalise an unidentified “raw” current to a convenient engineering value without a traceable ratio.
Plan the acceptance checks before deployment
The campaign should have a pre-deployment and post-deployment checklist:
- Verify the monitor configuration against the approved channel schedule.
- Confirm the reported phase voltages and currents are plausible for the known state.
- Check phase sequence, power direction, CT ratio and neutral-channel assignment.
- Compare the monitor clock with the approved reference.
- Confirm trigger thresholds and pre/post-event capture without assuming they cover every event.
- Record instrument serial number, firmware, calibration and storage capacity.
- Take a stable baseline under a known operating condition.
- Confirm the data can be exported and re-imported without changing units or timestamps.
- Record the exact event or operating states that occur during the campaign.
At retrieval, verify again that channel scaling and time have not changed. Record firmware downloads or configuration changes. Preserve the original export, not only a manually edited spreadsheet. A report table should make it possible to trace every headline value back to point, phase, interval, instrument and operating state.
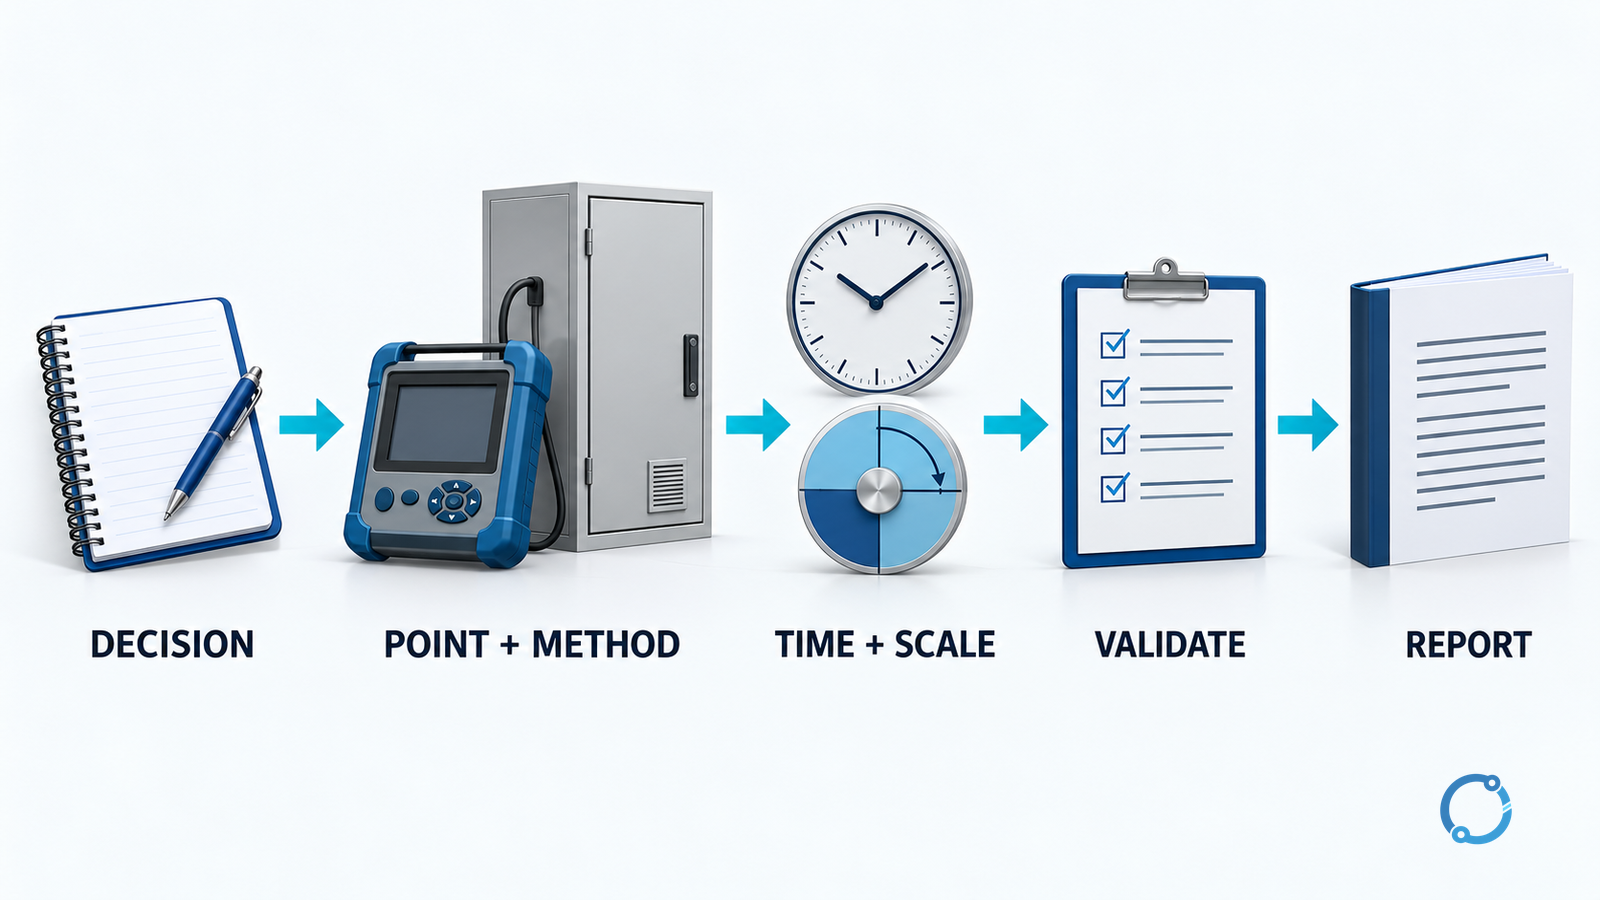
Eight gates for a reviewable plan
Gate 1: decision and completion test
Name the decision, the audience and the evidence that would close it. If the question cannot be expressed independently of a particular instrument, it is not yet a measurement objective.
Gate 2: system and operating boundary
Draw the electrical and control boundary. List normal, upset, startup, transfer and maintenance states. Identify the observations that will establish which state was active.
Gate 3: measurement points
Assign a unique point to every relevant voltage and current boundary. Explain why each extra point is needed and what comparison it enables.
Gate 4: phenomenon and method
Map each required output to a measurement method, aggregation and event definition. Separate measurement method from the contractual or compatibility limit.
Gate 5: duration and storage
Set the observation period or event-count stopping rule. Check the monitor’s storage, sample rate, aggregation and export format against that period.
Gate 6: time, phase and scaling
Document the shared clock, phase convention, CT/VT ratio, polarity and positive-power direction. Record how these will be checked.
Gate 7: data-validation path
Define how missing intervals, interrupted communications, firmware changes, clock errors and operator annotations will be detected and recorded. Do not silently interpolate a gap.
Gate 8: reporting and retention
Define the final dataset, report fields, alarm list, owner, retention period and update trigger. State whether the programme is temporary or permanent.
A compact report structure
A useful report normally contains more than a screenshot:
| Report element | Evidence it should carry |
|---|---|
| Decision question | Original objective and success or closing condition |
| Measurement map | Point, voltage level, upstream device, downstream load and boundary |
| Channel schedule | Quantity, unit, phase, CT/VT ratio, aggregation and trigger |
| Instrument record | Class, serial number, firmware, calibration and settings hash or snapshot |
| Time basis | Time zone, synchronisation and observed offset |
| Operating log | Events, process steps, switching actions and who recorded them |
| Data-quality notes | Missing periods, saturation, scaling changes and invalid samples |
| Findings | Measurement result, compared limit and link to the originating evidence |
| Limitations | What the campaign cannot establish |
Do not present a compatibility conclusion unless the limit, jurisdiction, assessment period and measurement basis are known. If the campaign is diagnostic rather than compliance-oriented, label it as such.
What to do when the data do not answer the question
A failed campaign is still useful if the gap is recorded. The voltage events may have occurred at a point that was not monitored. The process may have changed during the campaign. A monitor may have saturated because of an incorrect range. The CT scaling may have been entered after the event. The full dataset may have been overwritten because storage was underestimated.
Resolve the evidence gap before repeating the study. Review the measurement map, logs and instrument settings with the people who know the equipment. If the event is too fast, select an instrument and trigger method capable of capturing it. If the event is too rare, consider an event-triggered permanent monitor. If the relevant voltage is not available at the intended location, use an engineered measurement solution rather than treating a control-voltage reading as the main bus voltage.
Final verification before closing the campaign
Close only when the original decision, each measured value, its phase and time basis and the operating state can be traced through the evidence chain. Confirm that all reported limits come from a citable source and that measurement method is not confused with compatibility requirement. Record who reviewed the data, which device or channel was excluded and whether the original files are retained.
The output of a good plan is not a larger file. It is a smaller set of defensible conclusions linked to an evidence trail that another engineer can audit. That is also the foundation for useful comparison with OHELE’s guides on troubleshooting voltage sags and swells, VFD harmonic mitigation, neutral conductor sizing with harmonics and voltage unbalance measurement.
Sources
- IEC 61000-4-30:2025 — Power quality measurement methods
- IEEE 1159-2019 — Recommended practice for monitoring electric power quality
- IEEE 519-2022 — Harmonic control in electric power systems
- IEC 61000-4-7 — Harmonic and interharmonic measurement methods
- IEC 61000-4-15:2010 with interpretation sheet — Flickermeter
- OSHA 29 CFR 1910.333 — Selection and use of work practices