
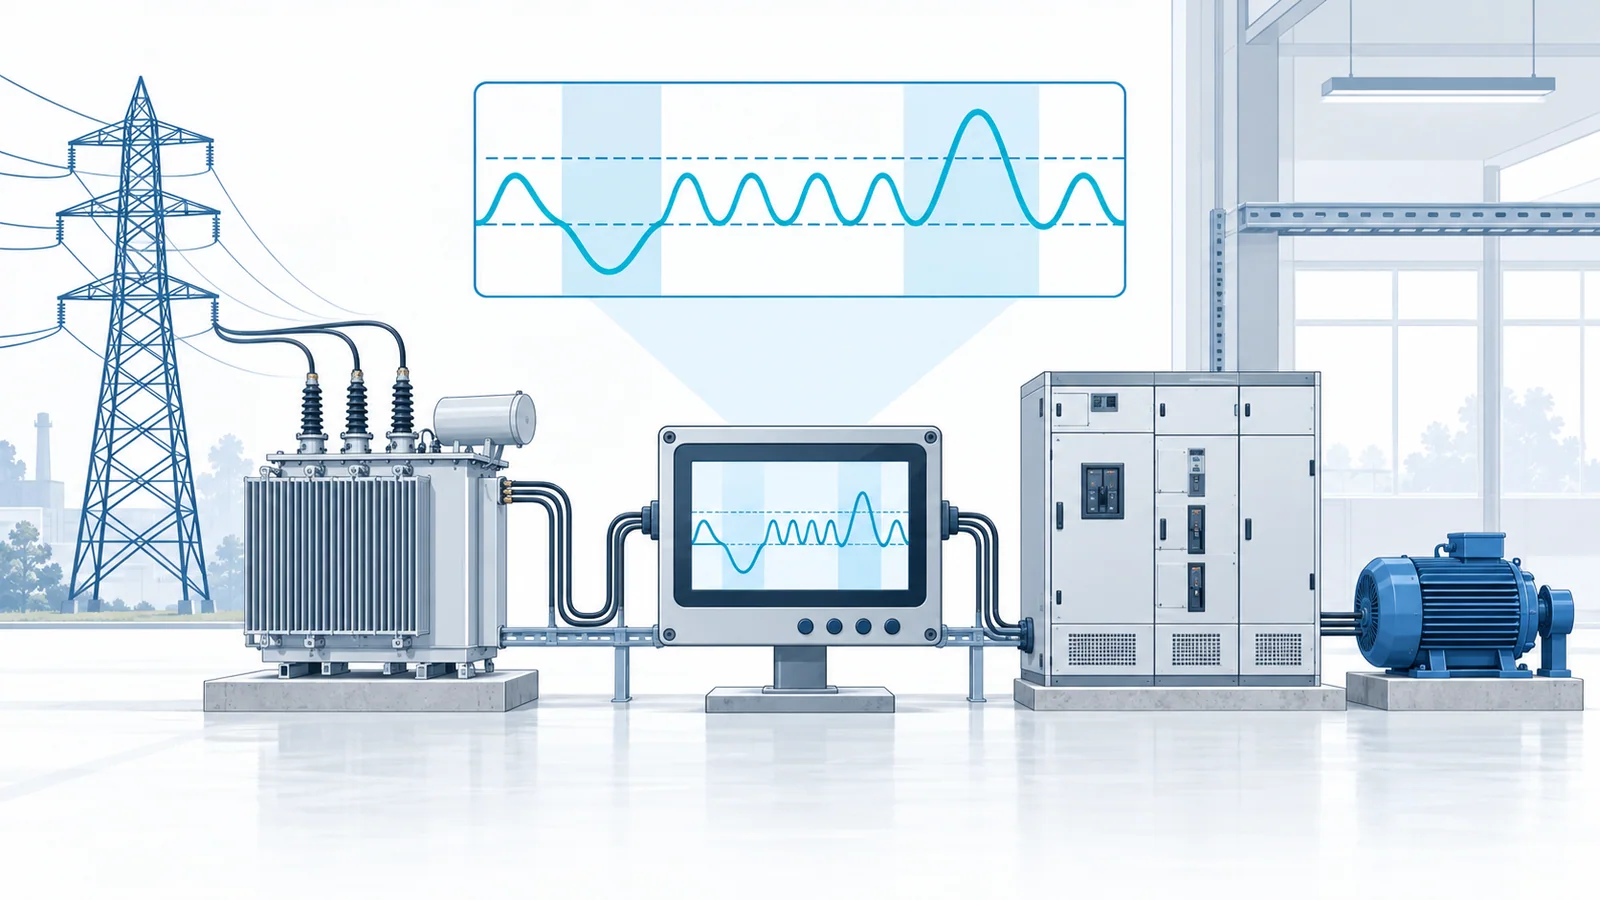
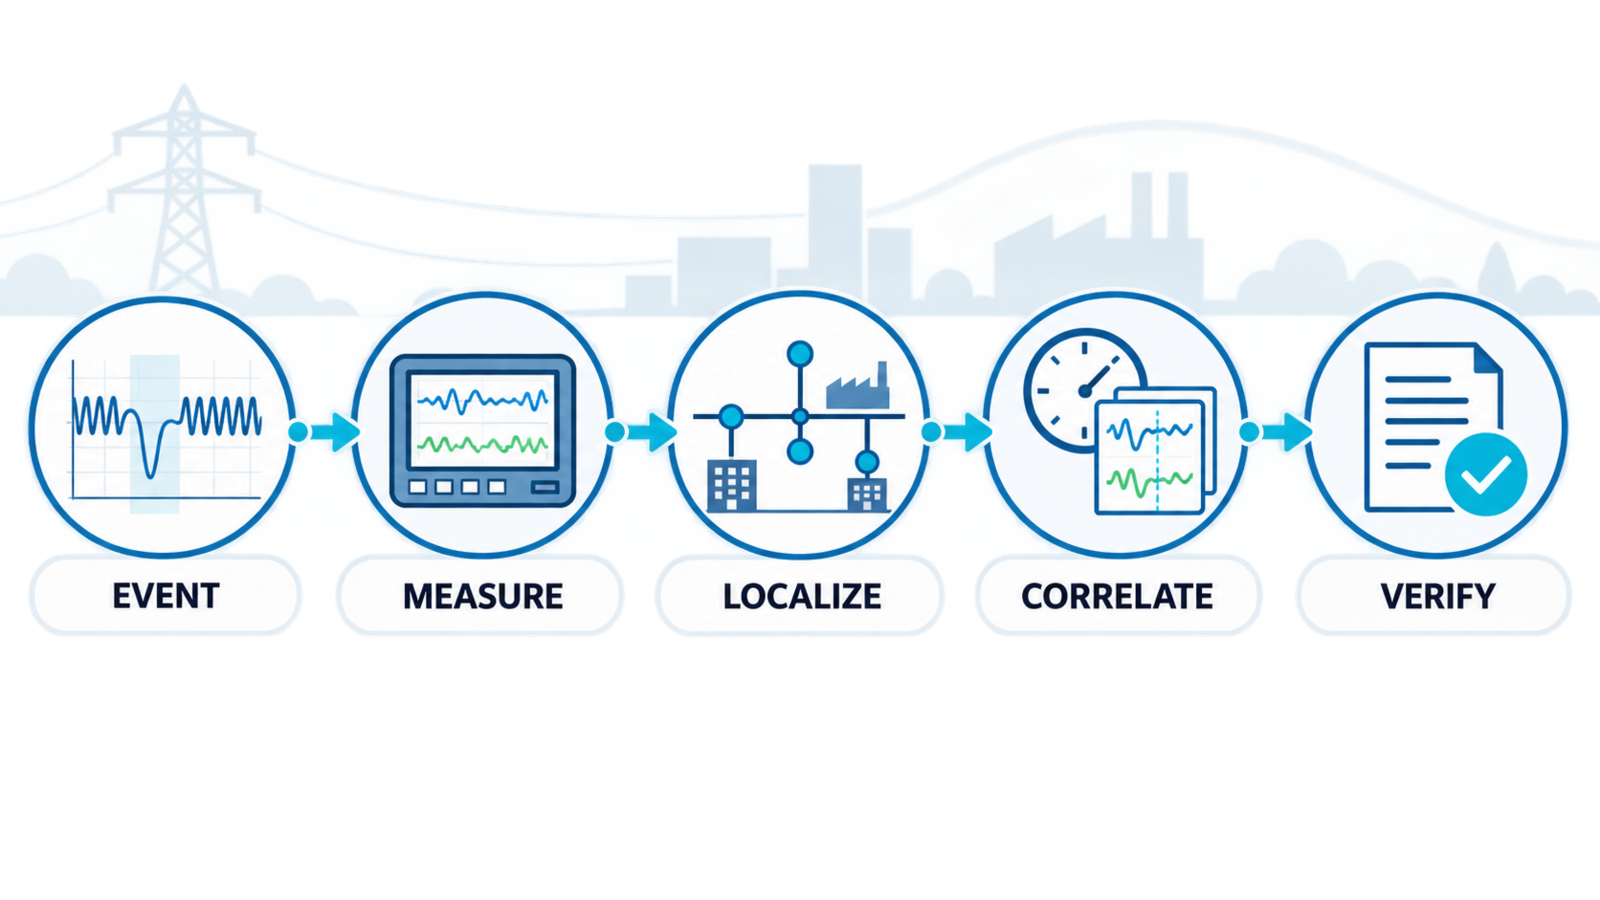
Voltage sags and swells are best troubleshot as timed system events, not as isolated voltage readings. First verify that an event occurred with a suitable power-quality instrument. Then compare voltage, current, phase involvement, duration, and operating logs at more than one point in the system. That evidence usually reveals whether the disturbance originated upstream, inside the facility, or at one sensitive load.
The investigation should end with a demonstrated cause-and-effect chain: event → location → initiating condition → affected equipment → verified corrective action. Replacing equipment before establishing that chain often hides the evidence without removing the cause.
Safety boundary
Installing instruments in switchboards, motor-control centers, substations, or exposed electrical equipment can involve shock, arc-flash, induced-voltage, stored-energy, and inadvertent-reclosing hazards. Measurements and connections must be made by qualified personnel under the site’s risk assessment, isolation, lockout/tagout, test-equipment, and personal protective equipment procedures.
Where conductors or parts have been de-energized for access, absence of voltage must be verified with appropriate test equipment rather than inferred from an indicator alone. The OSHA interpretation on verification of de-energization illustrates this principle for US workplaces; other jurisdictions require their own applicable rules and procedures.
This article explains the diagnostic logic. It is not an instruction to open energized equipment or install temporary monitors without the required competence and controls.
Confirm that the event is actually a sag or swell
A sag is a temporary reduction in RMS supply voltage. A swell is a temporary increase. Both differ from a complete interruption, a fast transient, steady undervoltage or overvoltage, harmonic distortion, and voltage unbalance. Similar operator reports—lights dimmed, a drive tripped, a contactor dropped out—can come from different phenomena.
Use the terminology and event records produced by the selected measurement method. IEC 61000-4-30:2025 defines repeatable methods for measuring power-quality parameters including supply-voltage dips, swells, interruptions, rapid voltage changes, unbalance, harmonics, and current. IEEE 1159-2019 provides a framework for monitoring and interpreting power-system quality phenomena.
Before diagnosing a cause, check:
- the instrument class and configuration;
- nominal voltage and wiring arrangement entered in the instrument;
- channel polarity and phase assignment;
- event thresholds, hysteresis, aggregation, and recording duration;
- time synchronization with protective relays, drives, programmable logic controllers, and operations logs;
- whether voltage was measured phase-to-phase, phase-to-neutral, or both;
- whether current and waveform captures are available for the same event.
A single handheld minimum or maximum reading rarely contains enough information to locate an event.
Read voltage and current together
Voltage describes the symptom. Current often reveals the initiating load or fault.
- A voltage sag accompanied by a large current increase at the same monitoring point suggests a downstream fault, motor start, transformer energization, or another high-current event.
- A sag with little local current change may have originated upstream of that point or on a neighboring feeder.
- A swell following a sudden current reduction can indicate abrupt load rejection or a control response to the removed load.
- A change concentrated on one phase or in phase-to-neutral voltages may point toward an unbalanced event, neutral-path problem, or single-phase switching condition.
- Simultaneous events on all monitored feeders are more consistent with a common upstream source than with several unrelated load faults.
These are diagnostic clues, not final conclusions. Transformer connections, grounding, monitor location, distributed generation, voltage regulation, and system impedance can change what is observed.
Symptom–cause–test–action matrix
| Recorded pattern | Plausible causes | Evidence to collect | Appropriate next action |
|---|---|---|---|
| Sag on all phases with a current surge on one outgoing feeder | Downstream fault, large motor acceleration, transformer energization | Feeder current, protection event records, starter or breaker timestamps, waveform capture | Inspect the identified feeder and correlate with the initiating operation before changing settings |
| Sag at the service entrance and major downstream buses at the same time | Utility or upstream network event, common transformer or feeder disturbance | Synchronized monitors, utility event data, relay targets, weather and switching logs | Preserve records and coordinate with the supply utility or network operator |
| Sag only near one load | Local conductor impedance, connection defect, undersized source, load inrush | Upstream/downstream voltage comparison, current, thermal and connection inspection under an approved procedure | Correct the local installation or starting method after engineering review |
| Swell after a large load disconnects | Load rejection, regulator or tap-control response | Current step, voltage trend, regulator position, switching log | Review voltage-control response and operating sequence |
| Swell mainly on one phase-to-neutral channel | Neutral displacement, grounding or wiring issue, unbalanced switching | All phase-to-phase and phase-to-neutral voltages, neutral condition, wiring verification | Escalate for qualified inspection; treat abnormal neutral conditions as a safety concern |
| Equipment trips without a matching bus-voltage event | Local control-power issue, device sensitivity, communication fault, incorrect monitor location | Control voltage, DC bus, device event log, local waveform capture | Move measurement closer to the affected equipment and verify its ride-through requirements |
A practical diagnostic sequence
1. Define the affected boundary
List the equipment that changed state and the equipment that did not. Record the exact time, operating mode, process load, protective-device indication, and recovery behavior. A precise boundary is more useful than a general statement that “the plant voltage dipped.”
2. Validate and preserve the event record
Export the original event data before changing thresholds or clearing logs. Preserve RMS trend, waveform, current, phase, duration, and timestamp data. Note the monitor location and voltage reference. Screenshots without configuration details are weak evidence.
3. Localize with synchronized measurement points
Place or use monitors at logical boundaries: point of common coupling, main bus, major feeder, and sensitive-load input. The disturbance source is often located between the last upstream point that did not record the same event and the first downstream point that did.
If only one monitor is available, move it methodically between boundaries over comparable operating periods. Do not compare unrelated production cycles as though they were synchronized measurements.
4. Correlate the event with system operation
Compare the timestamp with:
- motor starting and stopping;
- transformer energization;
- capacitor-bank or reactor switching;
- feeder or breaker operation;
- protection trips and automatic reclosing;
- generator, inverter, or automatic transfer activity;
- large process-load changes;
- utility switching or reported faults.
Correlation is strongest when the electrical signature, timestamp, and known operating sequence agree.
5. Test the leading hypothesis
Choose the least invasive test capable of disproving the suspected cause. Examples include repeating a scheduled motor start while monitoring the relevant buses, reviewing a relay oscillography record, or comparing control-power voltage with the main bus. Do not create a hazardous disturbance merely to reproduce an event.
6. Verify the corrective action
After a repair or control change, repeat the same measurement under a comparable operating condition. Confirm both that the initiating signature changed and that the affected equipment now remains within its documented operating requirements.
Common causes and what distinguishes them
Faults and protection operations
Network or feeder faults commonly produce abrupt sags. Protection records, current magnitude and phase, fault indicators, and simultaneous measurements help distinguish a local fault from an upstream event. Reclosing may create a sequence of closely spaced events rather than one isolated sag.
Motor starting and transformer energization
Large inrush or acceleration current can depress voltage across source and conductor impedance. The signature should align with a known start or energization command and its current profile. Long acceleration, repeated starts, weak sources, or an unexpected mechanical load can make a normal design event operationally disruptive.
Load rejection and voltage-control response
When a large load disconnects, voltage may rise until regulating equipment or system conditions establish a new operating point. Check the current step, regulator or tap position, reactive-power controls, and timing. A corrective action aimed only at the sensitive load may be inappropriate if the control response is the real problem.
Connections, neutral paths, and local impedance
Loose or deteriorated connections and abnormal neutral paths can create load-dependent voltage changes. These conditions require qualified inspection because they can also present thermal and shock hazards. Confirm with phase-resolved measurements and an approved de-energized inspection rather than tightening or probing live connections as a trial fix.
Equipment sensitivity and control-power weakness
The supply event may be real while only one device trips. Compare its documented ride-through behavior, control-power architecture, undervoltage settings, process interlocks, and DC-bus record with the measured event. The engineering question becomes whether to reduce the disturbance, improve the load’s immunity, or both.
Choosing a mitigation only after localization
| Confirmed problem | Mitigation families to evaluate |
|---|---|
| Large internal motor-starting sag | Starting method, acceleration profile, source capacity, feeder impedance, process sequence |
| Repeated upstream supply sags | Utility coordination, ride-through, uninterruptible or stored-energy support for critical control loads, process restart strategy |
| Load-rejection swell | Regulator settings and response, reactive-power switching, operating sequence, load staging |
| Local voltage drop | Connection repair, conductor or transformer review, circuit reconfiguration, load distribution |
| Sensitive control circuit | Control-power design, hold-up capability, undervoltage settings, segregation from disturbing loads |
The correct option depends on event magnitude and duration, load criticality, process recovery cost, system fault level, grounding, and local requirements. A mitigation must not compromise protection coordination, fault clearing, or equipment ratings.
Completion checklist
- The phenomenon was classified from recorded data rather than symptoms alone.
- Voltage and current were compared at the same timestamp.
- Monitor configuration and wiring were verified.
- The event boundary was localized with synchronized or methodically repeated measurements.
- Operations, relay, drive, and utility records were correlated.
- The leading hypothesis was tested without creating unsafe conditions.
- The corrective action was verified under a comparable operating condition.
- Original records, configuration, and conclusions were retained for recurrence analysis.